


- By NYS Comptroller's Office
- Around Town
 Print
Print 

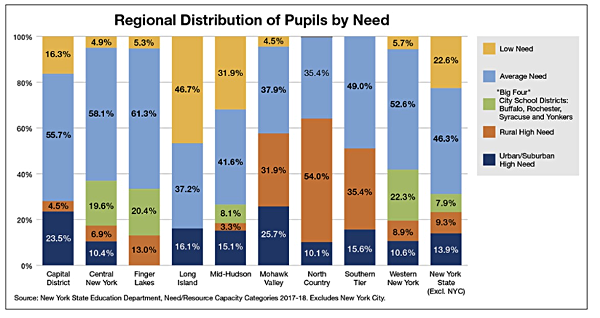
A new report by New York State Comptroller Thomas P. DiNapoli shows the challenges faced by the state's school districts are as varied as the state itself. Regional factors including the local economy, labor force mix and demographics all have implications for spending, pupil outcomes and the delivery of services, including special education. The report details school district demographic and financial information from nine separate regions outside New York City.
"School districts must navigate a complex set of state rules and local needs to determine how to best educate our children and pay for it," DiNapoli said. "My office's report identifies the regional changes and trends that could impact district budgets now and in the future. It is a useful tool to better inform lawmakers, stakeholders and taxpayers about local and statewide issues."
Revenue Picture
In the 2017-18 school year, districts received $40.6 billion in revenues, which included state and federal aid, the School Tax Relief program (STAR), and local property tax revenue. Property taxes made up more than half of the total revenues (53.1 percent), a modest increase from 2007-08 (51.9 percent). Over the same period, state aid as a percent of total revenues increased slightly from 37.1 percent to 38.3 percent, while the remaining shares both decreased with federal aid, declining from 3.4 percent to 2.9 percent and the STAR program dropping from 7.5 to 5.8 percent.
The percentage of revenues from each of these sources varies district-to-district. Since state aid formulas include factors intended to offset differences in local property values and incomes, districts with higher wealth, by these measures, generally receive less aid and rely more on property taxes. Long Island (66.3 percent) and the Mid-Hudson region (64.1 percent) had the highest percentages of revenues from property taxes. On the other end of the spectrum, the Mohawk Valley and North Country rely on state and federal sources for two-thirds of their revenue.
Spending Outpaces Inflation
School district spending outpaced inflation both regionally and statewide. Expenditures grew 26 percent between 2007-08 and 2017-18 compared to inflation of 16.6 percent.
In 2017-18, the median school district spent $24,737 per pupil. Districts in the Mid-Hudson and Long Island tend to be wealthier and spend more per pupil. The report notes many factors can affect the differences in spending including the local cost of labor, which is generally much higher in downstate regions.
Other findings in the report include:
- Enrollment is generally down, dropping at least 5 percent in most districts since 2007-08.
- According to the U.S. Census Bureau, about 14 percent of children in New York state (outside of New York City) lived in poverty in 2017. Long Island had the lowest concentration of students (less than 8 percent) and the Mohawk Valley had the highest (nearly 19 percent).
- A quarter-million students were classified as having a disability in 2017-18. Regionally, North Country districts had the highest percentage at 15.7 percent, while the Mid-Hudson had the lowest at 12.6 percent. Districts statewide spent, on average, $20,820 more per special education student than on general education students.
- The statewide four-year graduation rate for students with disabilities outside of New York City was 64 percent, compared to about 90 percent for general education students. Nearly a fifth of disabled students remained enrolled in school beyond four years of high school.
- Between 2007-08 and 2017-18, the total number of English language learners from K-12 increased from 59,222 to 91,448–a jump of 54.4 percent statewide. The percentages in the Capital District, Central New York and Western New York regions more than doubled. Nearly half of Long Island's increase was in just seven school districts.
- New York City, which is many times larger than the next largest school district in the state and has been discussed extensively in other analyses by the Office of the State Comptroller, is generally omitted from this regional presentation (including in the statewide comparisons).
v16i10